> ## Documentation Index
> Fetch the complete documentation index at: https://docs.zayo.com/llms.txt
> Use this file to discover all available pages before exploring further.
# DDoS Protection
#
This guide provides you with the necessary information to understand, monitor, and manage DDoS protection on their assigned IPs and services using the NaaS Platform. The NaaS Platform offers real-time, automated mitigation to ensure service continuity during DDoS attacks.
## 1. Introduction
The DynamicLink DDoS Protection service continuously monitors your internet-facing connections and automatically blocks large-scale DDoS attacks. As a user, you will interact with a user-friendly interface to view and manage your protection based on pre-defined rules set by the operator.
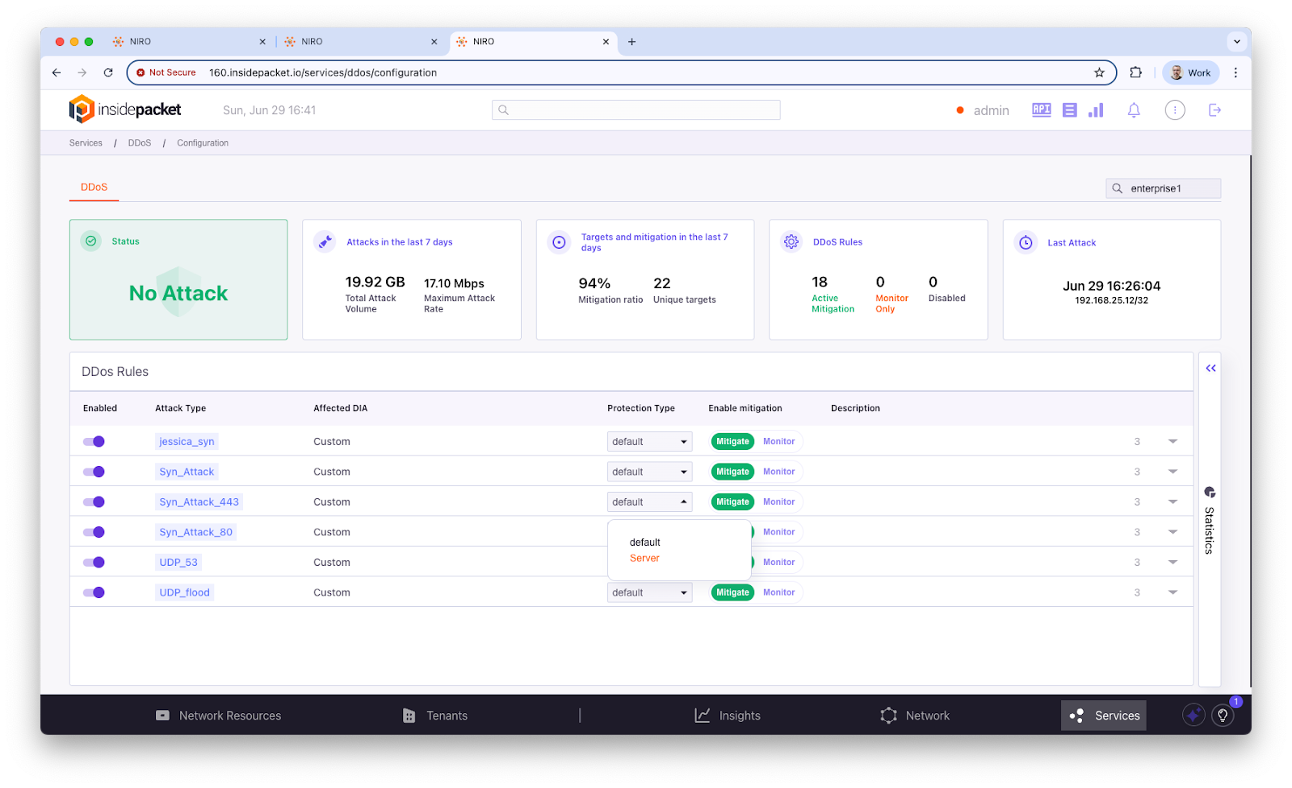 Figure 1: A high-level diagram showing how traffic is monitored and mitigated.
## 2. Access Requirements
To effectively use the DDoS protection service, ensure you meet the following requirements:
* **Valid tenant credentials:** Provided by your system administrator.
* **Network familiarity:** Understanding of IP ranges and hosted services.
* **Basic knowledge of common DDoS attack types.**
## 3. Key Concepts
Familiarize yourself with these core concepts:
* **Mitigation Status:** Indicates whether an IP is currently under protection.
* **Thresholds:** Limits set by the system administrator that trigger mitigation.
* **DUA (Device Under Attack):** Your IP currently being targeted by an attack.
* **False Positive:** Legitimate traffic mistakenly flagged as an attacker.
* **Per IP Visibility:** Each IP is tracked individually for accurate mitigation.
## 4. Enterprise Portal Overview
The Portal is your central hub for monitoring protected services.
Figure 1: A high-level diagram showing how traffic is monitored and mitigated.
## 2. Access Requirements
To effectively use the DDoS protection service, ensure you meet the following requirements:
* **Valid tenant credentials:** Provided by your system administrator.
* **Network familiarity:** Understanding of IP ranges and hosted services.
* **Basic knowledge of common DDoS attack types.**
## 3. Key Concepts
Familiarize yourself with these core concepts:
* **Mitigation Status:** Indicates whether an IP is currently under protection.
* **Thresholds:** Limits set by the system administrator that trigger mitigation.
* **DUA (Device Under Attack):** Your IP currently being targeted by an attack.
* **False Positive:** Legitimate traffic mistakenly flagged as an attacker.
* **Per IP Visibility:** Each IP is tracked individually for accurate mitigation.
## 4. Enterprise Portal Overview
The Portal is your central hub for monitoring protected services.
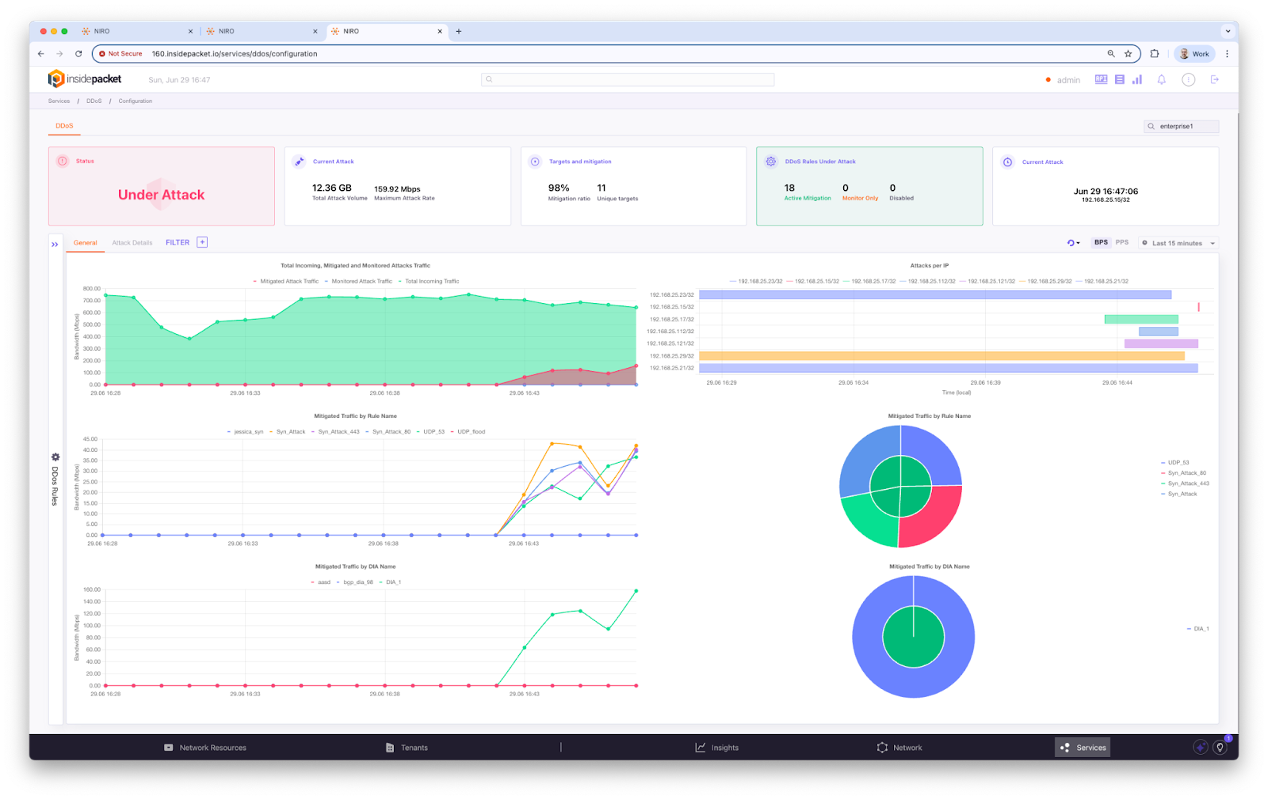 Figure 2: The Tenant Portal Dashboard displaying real-time activity.
* **Dashboard:** Displays real-time and historical DDoS activity, active threats, protected IPs, and mitigation activity.
* **Traffic View:** Shows traffic trends per IP, both historical and real-time.
* **Thresholds:** Can be reviewed and, if permitted, adjusted.
* **Logs:** Available for download and review.
* **Alerts:** Notify you of detected threats and mitigation actions.
## 5. Daily Operations
Follow these steps for routine monitoring and management:
### 5.1. Monitor Traffic
1. Log in to the NaaS portal.
2. Open **Dashboard** ⇒ **Live View**.
3. Observe per IP trends and spikes.
### 5.2. Review Alerts
1. Navigate to **Alert** ⇒ **Recent Events**.
2. Filter by IP or timestamp.
3. Acknowledge resolved alerts.
### 5.3. Export Reports
1. Go to **Logs** ⇒ **Export**.
2. Select format: CSV, JSON.
3. Download for compliance use.
## 6. How to Use DDoS Protection
As a tenant, you have a simplified view of DDoS protection. Most complex logic is handled by your provider, but you can manage basic settings.
### 6.1. Know Which Rules Apply to You
* **Tenant Global Rules:** Always on and cannot be changed.
* **Tenant Template Rules:** Can be enabled/disabled or switched to monitor mode if the option is provided.
* **Tenant Specific Rules:** Custom rules unique to your organization.
### 6.2. Manage Your Rules
1. Go to NaaS portal ⇒ **Services** ⇒ **DDoS display screen**.
2. View the available rules, each with a name and description.
3. If a rule has options:
- You may enable or disable it.
- You may switch it to monitor mode to observe attacks without blocking.
- You may apply the rule to specific IPs or subnets in your network.
## 7. DDoS Statistics
Access detailed DDoS statistics to monitor and analyze attack trends.
### 7.1. Accessing DDoS Statistics
1. Log in to the NaaS portal.
2. Go to the left navigation panel ⇒ Click on **Service**.
3. Select **DDoS**.
4. The statistics dashboard will be displayed.
Figure 2: The Tenant Portal Dashboard displaying real-time activity.
* **Dashboard:** Displays real-time and historical DDoS activity, active threats, protected IPs, and mitigation activity.
* **Traffic View:** Shows traffic trends per IP, both historical and real-time.
* **Thresholds:** Can be reviewed and, if permitted, adjusted.
* **Logs:** Available for download and review.
* **Alerts:** Notify you of detected threats and mitigation actions.
## 5. Daily Operations
Follow these steps for routine monitoring and management:
### 5.1. Monitor Traffic
1. Log in to the NaaS portal.
2. Open **Dashboard** ⇒ **Live View**.
3. Observe per IP trends and spikes.
### 5.2. Review Alerts
1. Navigate to **Alert** ⇒ **Recent Events**.
2. Filter by IP or timestamp.
3. Acknowledge resolved alerts.
### 5.3. Export Reports
1. Go to **Logs** ⇒ **Export**.
2. Select format: CSV, JSON.
3. Download for compliance use.
## 6. How to Use DDoS Protection
As a tenant, you have a simplified view of DDoS protection. Most complex logic is handled by your provider, but you can manage basic settings.
### 6.1. Know Which Rules Apply to You
* **Tenant Global Rules:** Always on and cannot be changed.
* **Tenant Template Rules:** Can be enabled/disabled or switched to monitor mode if the option is provided.
* **Tenant Specific Rules:** Custom rules unique to your organization.
### 6.2. Manage Your Rules
1. Go to NaaS portal ⇒ **Services** ⇒ **DDoS display screen**.
2. View the available rules, each with a name and description.
3. If a rule has options:
- You may enable or disable it.
- You may switch it to monitor mode to observe attacks without blocking.
- You may apply the rule to specific IPs or subnets in your network.
## 7. DDoS Statistics
Access detailed DDoS statistics to monitor and analyze attack trends.
### 7.1. Accessing DDoS Statistics
1. Log in to the NaaS portal.
2. Go to the left navigation panel ⇒ Click on **Service**.
3. Select **DDoS**.
4. The statistics dashboard will be displayed.
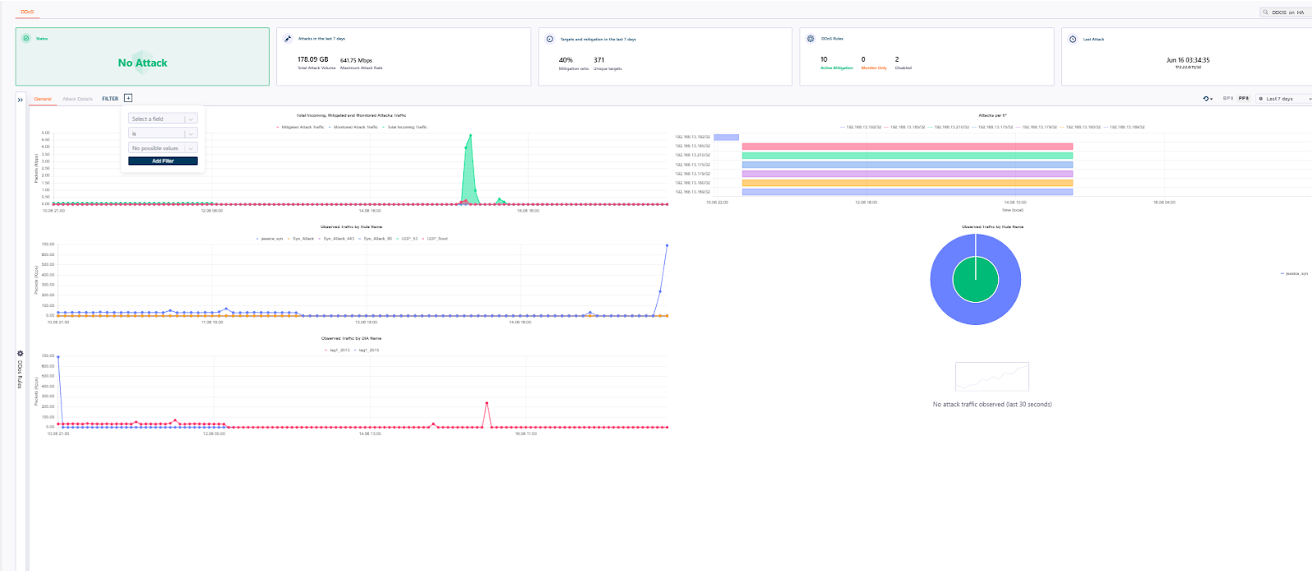 Figure 5: The main DDoS statistics dashboard.
### 7.2. Top Summary Section
* **Status:** Real-time indicator (e.g., "No Attack" - green means no attack detected).
* **Attack in last 7 days:** Displays total mitigated traffic (in GB) and peak mitigation rate (in Mbps).
* **Target & Mitigation Rate:** Shows mitigation success rate (%) and unique attack targets over the past 7 days.
* **DDoS Status Summary:** Breakdown of current system status (Active Mitigation, Monitor Only, Disabled).
* **Last Attack:** Timestamp of the most recent detected attack.
### 7.3. Dashboard Tabs & Filter
* **Tab (General/Attack Details):**
- **General:** Summary view of traffic, attack patterns, and mitigated flows.
- **Attack Details:** Detailed session breakdown.
* **Filter Panel:** Apply filters by fields like Rule Name, DIA Name, Target IP.
* **CSV:** Export DDoS attack data for offline analysis.
### 7.4. Graph and Charts
* **Total Incoming and Mitigation Traffic (Top Graph):**
- Green area: Successfully mitigated traffic.
- Red Line: Unblocked attack traffic that passed through.
- Blue Line: Total incoming traffic.
- Use this to compare actual threats and mitigation effectiveness.
* **Observed Traffic by Traffic Name:** Traffic classification by protocol or service (e.g., DNS, ICMP, UDP Flood). Helps identify the nature of attack or abnormal traffic flow.
* **Observed Traffic By Rule Name:** Shows what traffic was flagged by which DDoS rule (e.g., ICMP\_Flood, TCP\_SYN). Useful for reviewing rule effectiveness.
### 7.5. Visualization Panels (Right Side)
* **Attack per IP (Bar Chart):** Horizontal bar showing targeted IP addresses and attack volume per IP.
* **Observed Traffic By Rule (Pie Chart):** Breakdown of mitigated traffic by DDoS rule type.
Figure 5: The main DDoS statistics dashboard.
### 7.2. Top Summary Section
* **Status:** Real-time indicator (e.g., "No Attack" - green means no attack detected).
* **Attack in last 7 days:** Displays total mitigated traffic (in GB) and peak mitigation rate (in Mbps).
* **Target & Mitigation Rate:** Shows mitigation success rate (%) and unique attack targets over the past 7 days.
* **DDoS Status Summary:** Breakdown of current system status (Active Mitigation, Monitor Only, Disabled).
* **Last Attack:** Timestamp of the most recent detected attack.
### 7.3. Dashboard Tabs & Filter
* **Tab (General/Attack Details):**
- **General:** Summary view of traffic, attack patterns, and mitigated flows.
- **Attack Details:** Detailed session breakdown.
* **Filter Panel:** Apply filters by fields like Rule Name, DIA Name, Target IP.
* **CSV:** Export DDoS attack data for offline analysis.
### 7.4. Graph and Charts
* **Total Incoming and Mitigation Traffic (Top Graph):**
- Green area: Successfully mitigated traffic.
- Red Line: Unblocked attack traffic that passed through.
- Blue Line: Total incoming traffic.
- Use this to compare actual threats and mitigation effectiveness.
* **Observed Traffic by Traffic Name:** Traffic classification by protocol or service (e.g., DNS, ICMP, UDP Flood). Helps identify the nature of attack or abnormal traffic flow.
* **Observed Traffic By Rule Name:** Shows what traffic was flagged by which DDoS rule (e.g., ICMP\_Flood, TCP\_SYN). Useful for reviewing rule effectiveness.
### 7.5. Visualization Panels (Right Side)
* **Attack per IP (Bar Chart):** Horizontal bar showing targeted IP addresses and attack volume per IP.
* **Observed Traffic By Rule (Pie Chart):** Breakdown of mitigated traffic by DDoS rule type.
 Figure 7: Visualization panels showing attack distribution by IP and rule type.
* **Live Update Indicator:** Message like “No attack traffic observed (last 30 seconds)” shows the current state of threat in near real time.
### 7.6. Time Selection (Top Right)
* Use the dropdown to change data granularity (Auto, 30s, 1m, 5m, 1h).
* Allows switching between BPS (Bits Per Second) and PPS (Packet Per Second).
* Time range: Last hour/last 7 days.
## 8. Use Case Scenarios
### 8.1. Use Case 1: SYN Flood Attack
1. An alert is triggered on one of your web servers.
2. Mitigation is automatically applied.
3. You view affected IP and traffic patterns in real-time.
4. Download a report for internal analysis.
Figure 7: Visualization panels showing attack distribution by IP and rule type.
* **Live Update Indicator:** Message like “No attack traffic observed (last 30 seconds)” shows the current state of threat in near real time.
### 7.6. Time Selection (Top Right)
* Use the dropdown to change data granularity (Auto, 30s, 1m, 5m, 1h).
* Allows switching between BPS (Bits Per Second) and PPS (Packet Per Second).
* Time range: Last hour/last 7 days.
## 8. Use Case Scenarios
### 8.1. Use Case 1: SYN Flood Attack
1. An alert is triggered on one of your web servers.
2. Mitigation is automatically applied.
3. You view affected IP and traffic patterns in real-time.
4. Download a report for internal analysis.
 Figure 8: A diagram showing the workflow during a SYN Flood Attack scenario.
### 8.2. Use Case 2: UDP Reflection Attack
1. You observe a sharp rise in UDP traffic from random sources.
2. Mitigation is visible, and traffic is filtered.
3. You confirm no DNS/NTP service degradation.
Figure 8: A diagram showing the workflow during a SYN Flood Attack scenario.
### 8.2. Use Case 2: UDP Reflection Attack
1. You observe a sharp rise in UDP traffic from random sources.
2. Mitigation is visible, and traffic is filtered.
3. You confirm no DNS/NTP service degradation.