

1. Initial Latency Analysis: Network and Application Latency
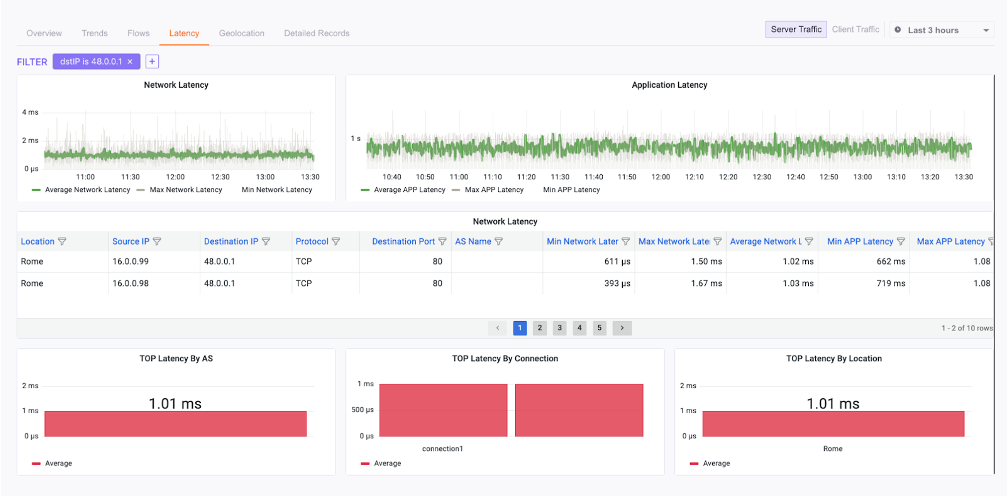
The first step is to differentiate between network latency (the time it takes for packets to travel) and application latency (the time it takes for the application to process a request). This distinction, available in the Network Observability dashboard, is key to narrowing down the problem.Steps to analyze latency
- Navigate to the “Insight” tab in the portal.
- Select “Network Observability” from the menu.
- Use the top navigation bar to focus on the “Latency” tab for granular data.
- Analyze the trends for the affected application target:
- Network & Application latency both increase: Investigate network bandwidth and packet drops (see Step 2).
- Network latency is stable, Application latency increases: The server is likely the bottleneck (see Step 3).
- Both are stable, but users report issues: DNS may be the culprit (see Step 4).
2. Investigating Network Latency and Bandwidth Issues
If your initial analysis points to a network problem, the next step is to examine bandwidth utilization and packet drops on the relevant links to identify congestion or policy enforcement issues.Steps to check bandwidth and drops
- Remain in the “Network Observability” dashboard.
- Go to the “Connection Overview” to review interface statistics for the relevant application connections.
- In the “Interface Statistics” section, pay close attention to:
Incoming (Mbps): Data received by the interface.Dropped Incoming (Mbps): Traffic discarded due to policy (e.g., reserved bandwidth).Outgoing (Mbps): Data sent from the interface.Dropped Outgoing (Mbps): Packets dropped due to policy constraints.
- Look for significant increases in
Dropped IncomingorDropped Outgoingpackets. Compare theIncomingandOutgoingvalues against the connection’s Max Bandwidth to see if the link is saturated. - If results are mixed, try to isolate the issue by source connection to see if a specific group of users is affected.
3. Analyzing Application Latency and Server Performance
If network metrics are healthy but application latency is high, the problem likely lies with the application server itself being underpowered or experiencing internal issues.Steps to infer server issues
- Review the application latency data from Step 1.
- If network-level metrics (latency, bandwidth, drops) are stable but the application’s overall performance remains poor, it strongly suggests a server-side issue.
- Navigate to the Application Observability Dashboard and review the “Top Applications Table” and “Top Applications Chart”. This can help confirm if the problem is isolated to one application or part of a broader server problem.
4. Checking DNS Resolution Issues
If both network and application performance appear stable but users still can’t access services, DNS resolution might be the culprit.Steps to check DNS queries
- From the “Insight” tab, select “Application Observability”.
- Navigate to the “DNS” tab within the dashboard.
- Examine the DNS activity, focusing on three sections:
- Source IPs: The clients making DNS queries.
- DNS Servers: The servers processing the queries.
- Hostname: The domains being requested.
- Look for missing or unusual query patterns for the application’s hostname. The “DNS Location” section can also help identify if the issue is related to a specific geographic DNS server.