
Date and traffic type filters
In the upper right, you can filter by the following:- Date range: Adjust the time window for all dashboard data.
- Client traffic: View analytics from the perspective of connection initiators (the endpoints sending the request). Select this filter to focus on users, workstations, and branch office devices making outbound requests. Top sources, geolocation, and latency metrics will be oriented around the client side of each session.
- Server traffic: View analytics from the perspective of the endpoints receiving connections (the servers responding to the request). Select this filter to focus on application servers, web servers, or cloud-hosted services. Top destinations, response patterns, and latency metrics will be oriented around the server side of each session.
Traffic filters
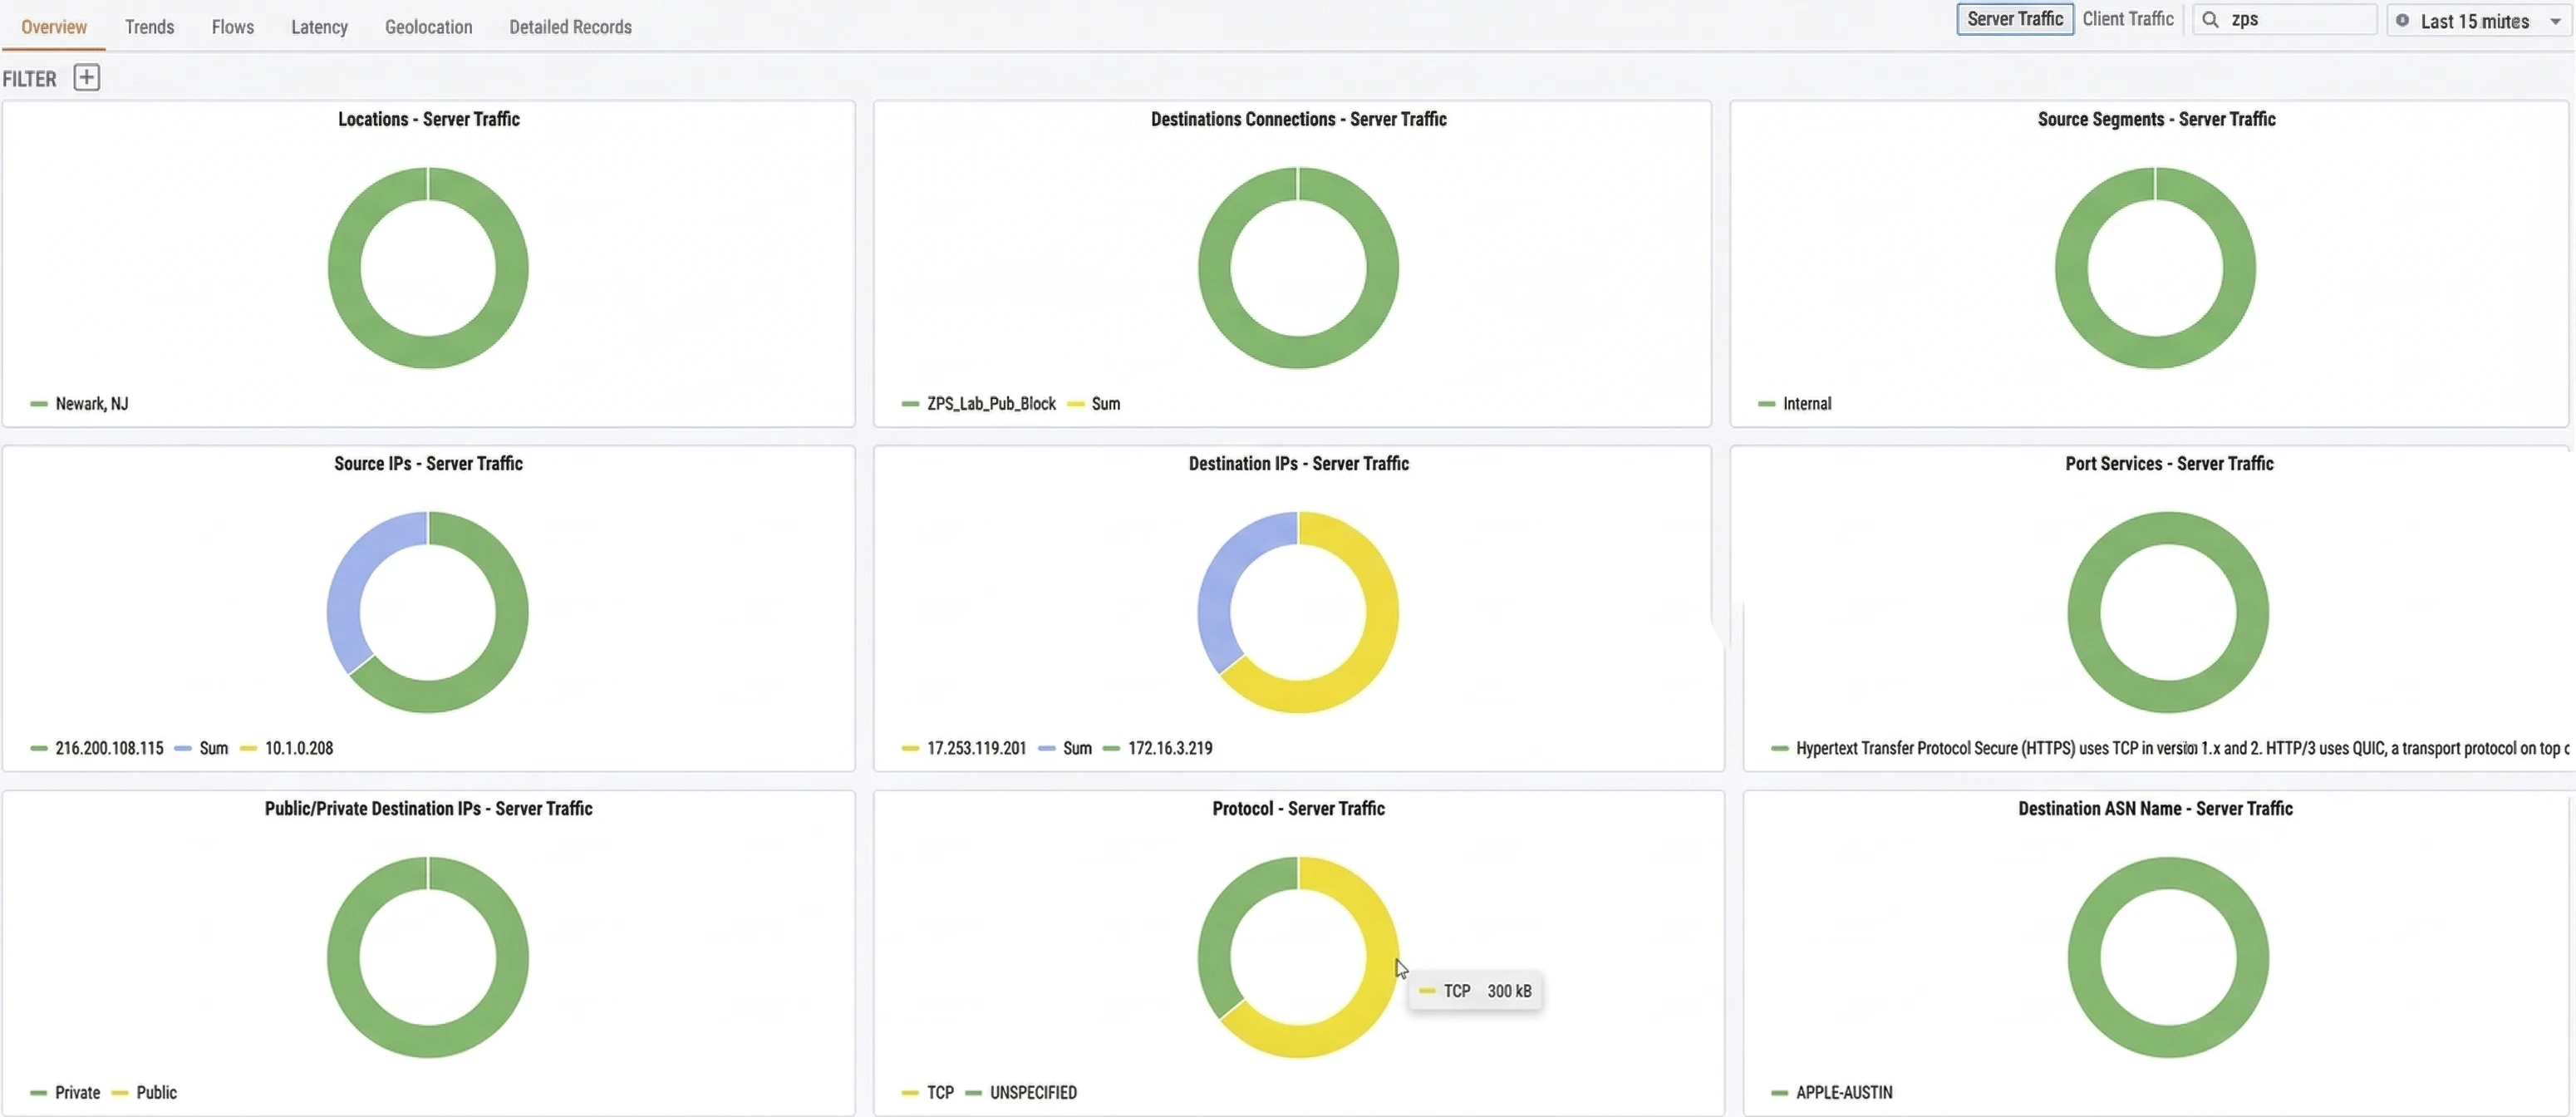
Under the tab name, there is a Filters option that allows you to narrow the dashboard data by a variety of filters, including locations, IPs, firewall rules, and source/destination criteria.Overview tab
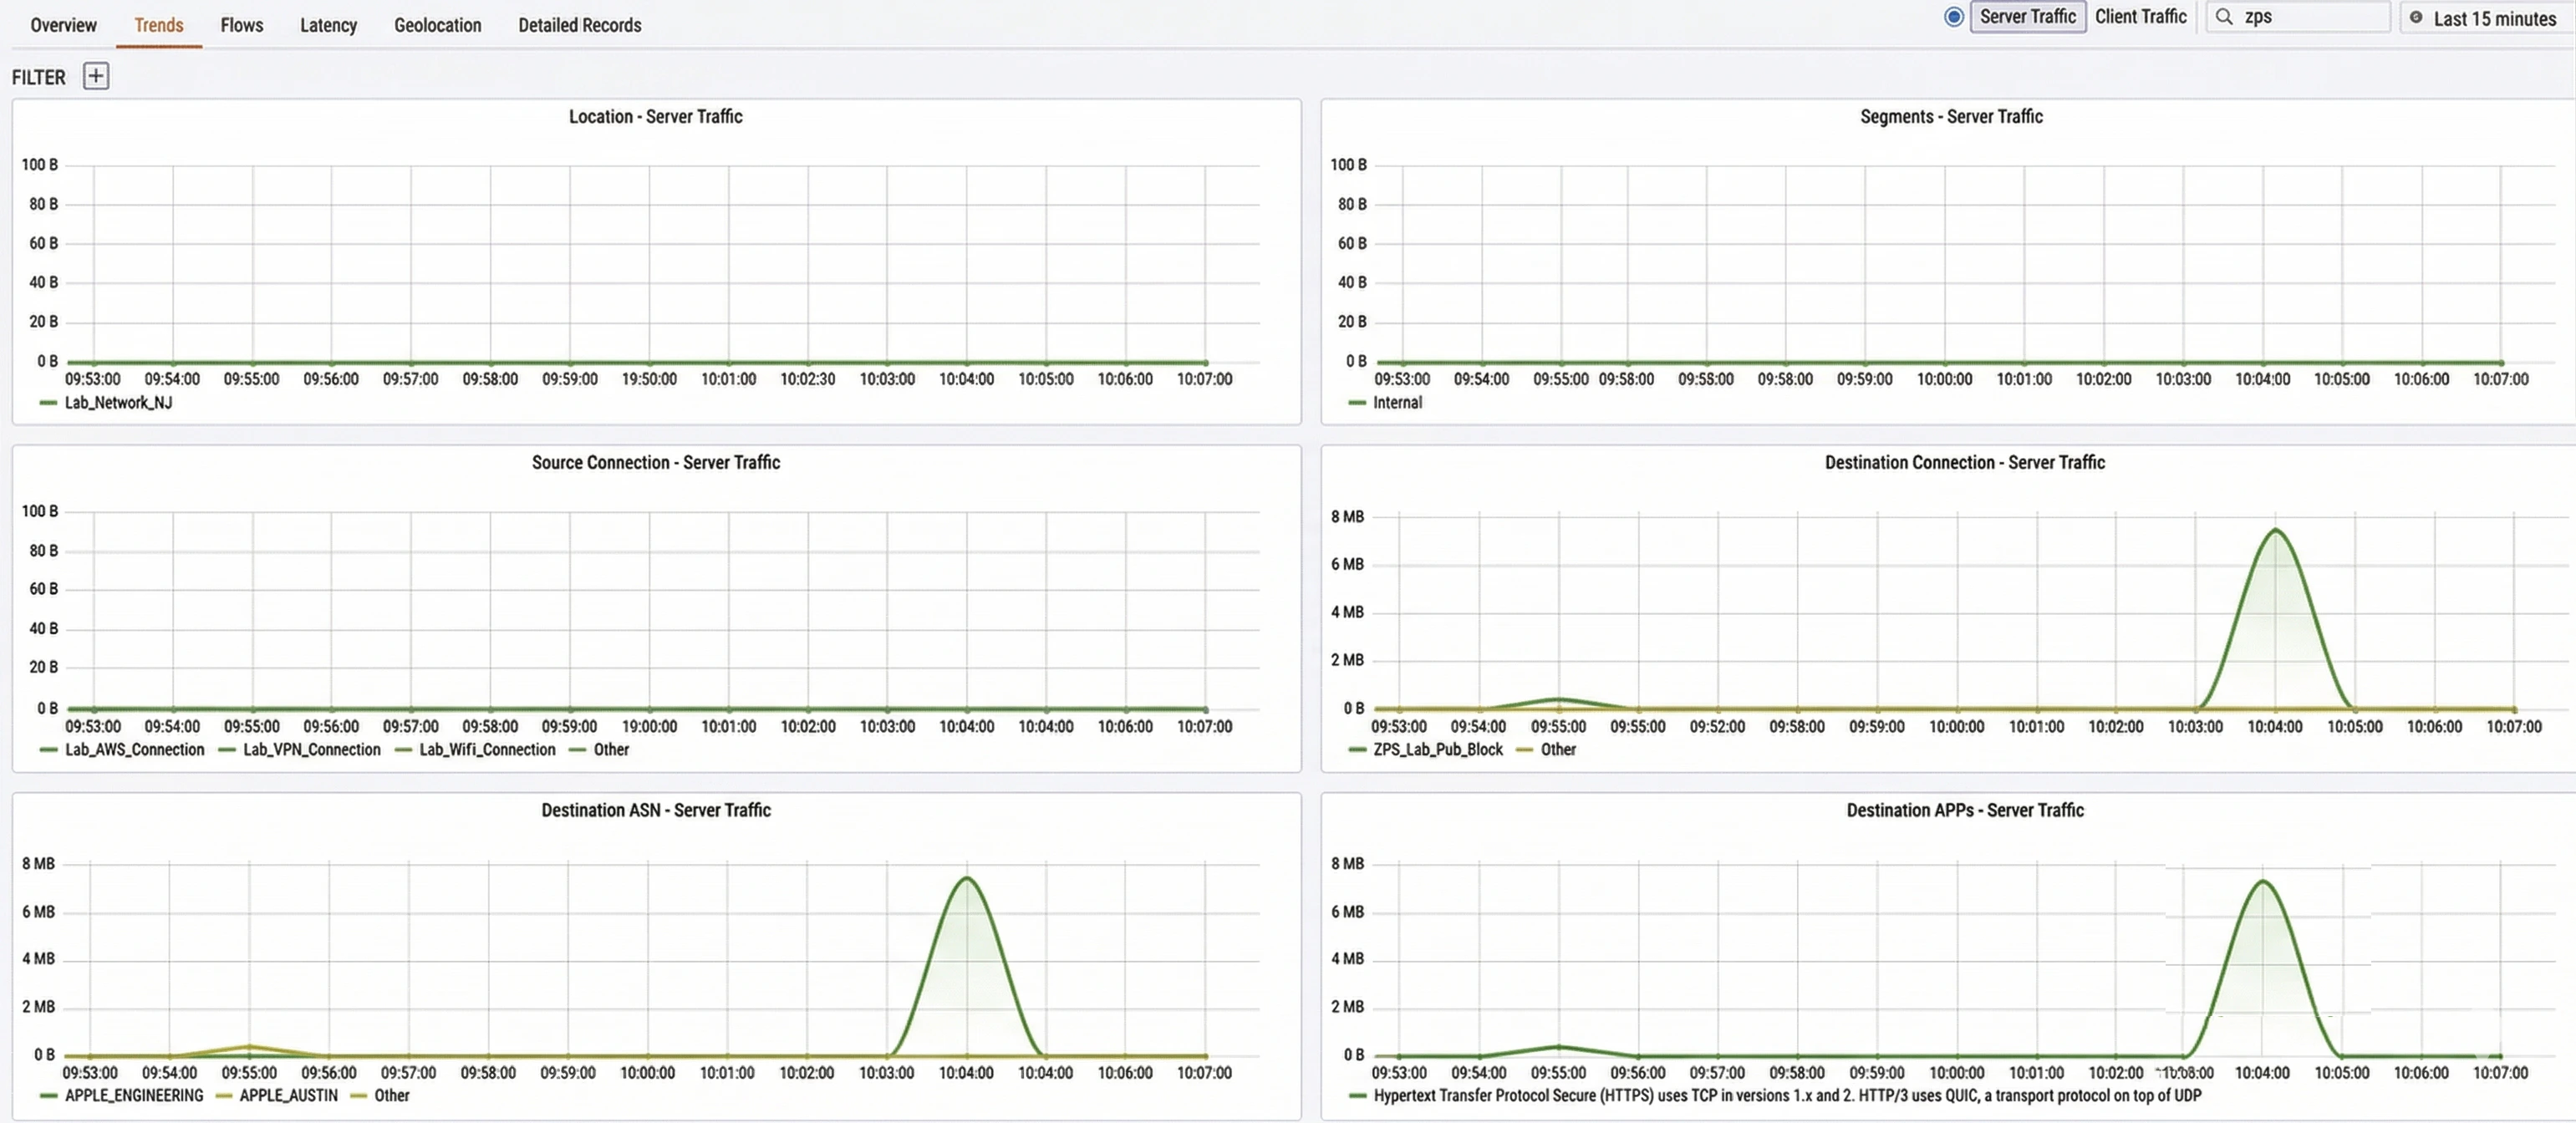
| Widget | Description |
|---|---|
| Locations | Breaks down traffic by physical location (e.g., Newark, NJ) so you can see which sites are generating or receiving the most traffic |
| Destinations Connections | Shows traffic distribution across your named connections and connection groups |
| Source Segments | Categorizes traffic by network segment type (e.g., Internal) |
| Source IPs | Identifies the top source IP addresses by traffic volume |
| Destination IPs | Identifies the top destination IP addresses by traffic volume |
| Port Services | Shows which application-layer services (e.g., HTTPS, QUIC) are consuming the most bandwidth |
| Public/Private Destination IPs | Splits destination traffic between public and private IP address space |
| Protocol | Breaks down traffic by transport protocol (e.g., TCP, UDP) |
| Destination ASN Name | Shows traffic distribution by destination Autonomous System Name, identifying which external networks your traffic is reaching |
Trends tab

| Widget | Description |
|---|---|
| Location | Traffic volume over time broken down by physical location (e.g., Lab_Network_NJ) |
| Segments | Traffic volume over time broken down by network segment type (e.g., Internal) |
| Source Connection | Traffic volume over time broken down by source connection name (e.g., Lab_AWS_Connection, Lab_VPN_Connection) |
| Destination Connection | Traffic volume over time broken down by destination connection name |
| Destination ASN | Traffic volume over time broken down by destination Autonomous System Name |
| Destination APPs | Traffic volume over time broken down by destination application or service |
Flows tab

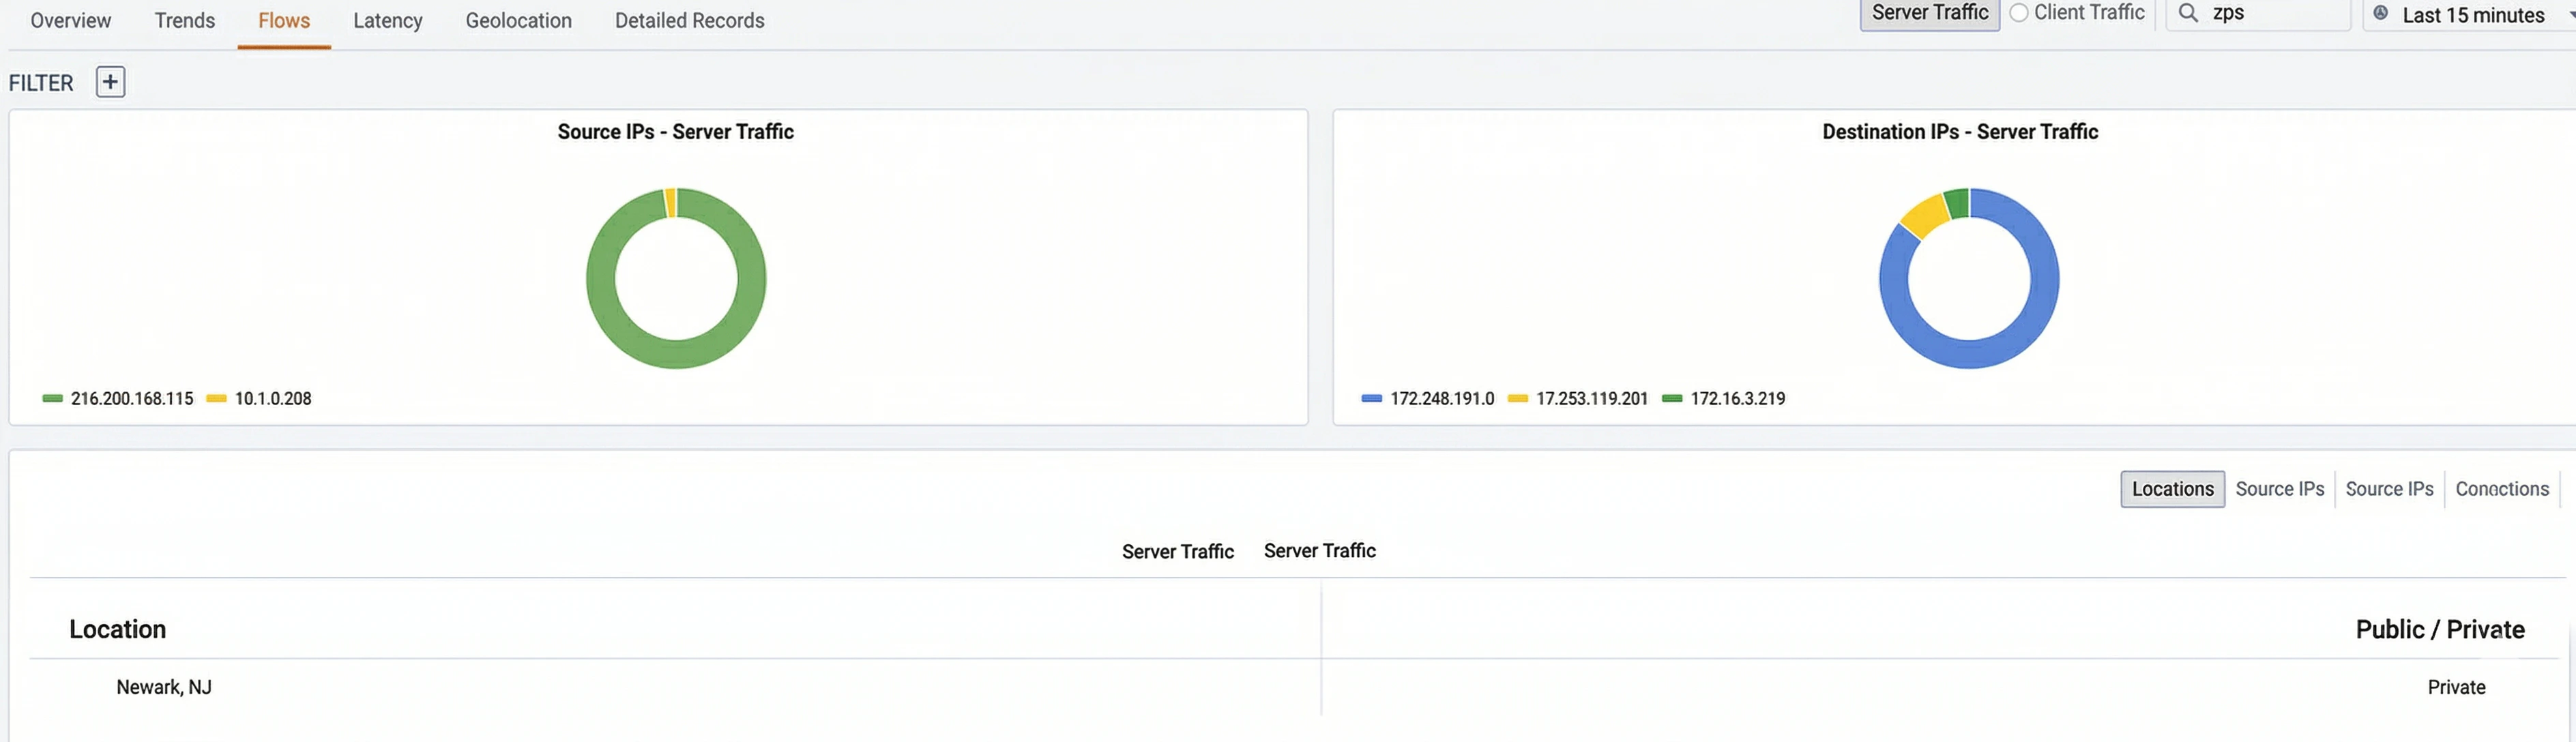
- Source IPs: Shows the top source IP addresses contributing to traffic.
- Destination IPs: Shows the top destination IP addresses receiving traffic. Below the charts, a table displays individual flow records. You can switch between views using the sub-tabs:
| Sub-tab | Description |
|---|---|
| Locations | Groups flows by physical location (e.g., Newark, NJ) and indicates whether the destination is Public or Private |
| Source IPs | Groups flows by source IP address |
| Source IPs | Groups flows by destination IP address |
| Connections | Groups flows by named connection |
Latency tab

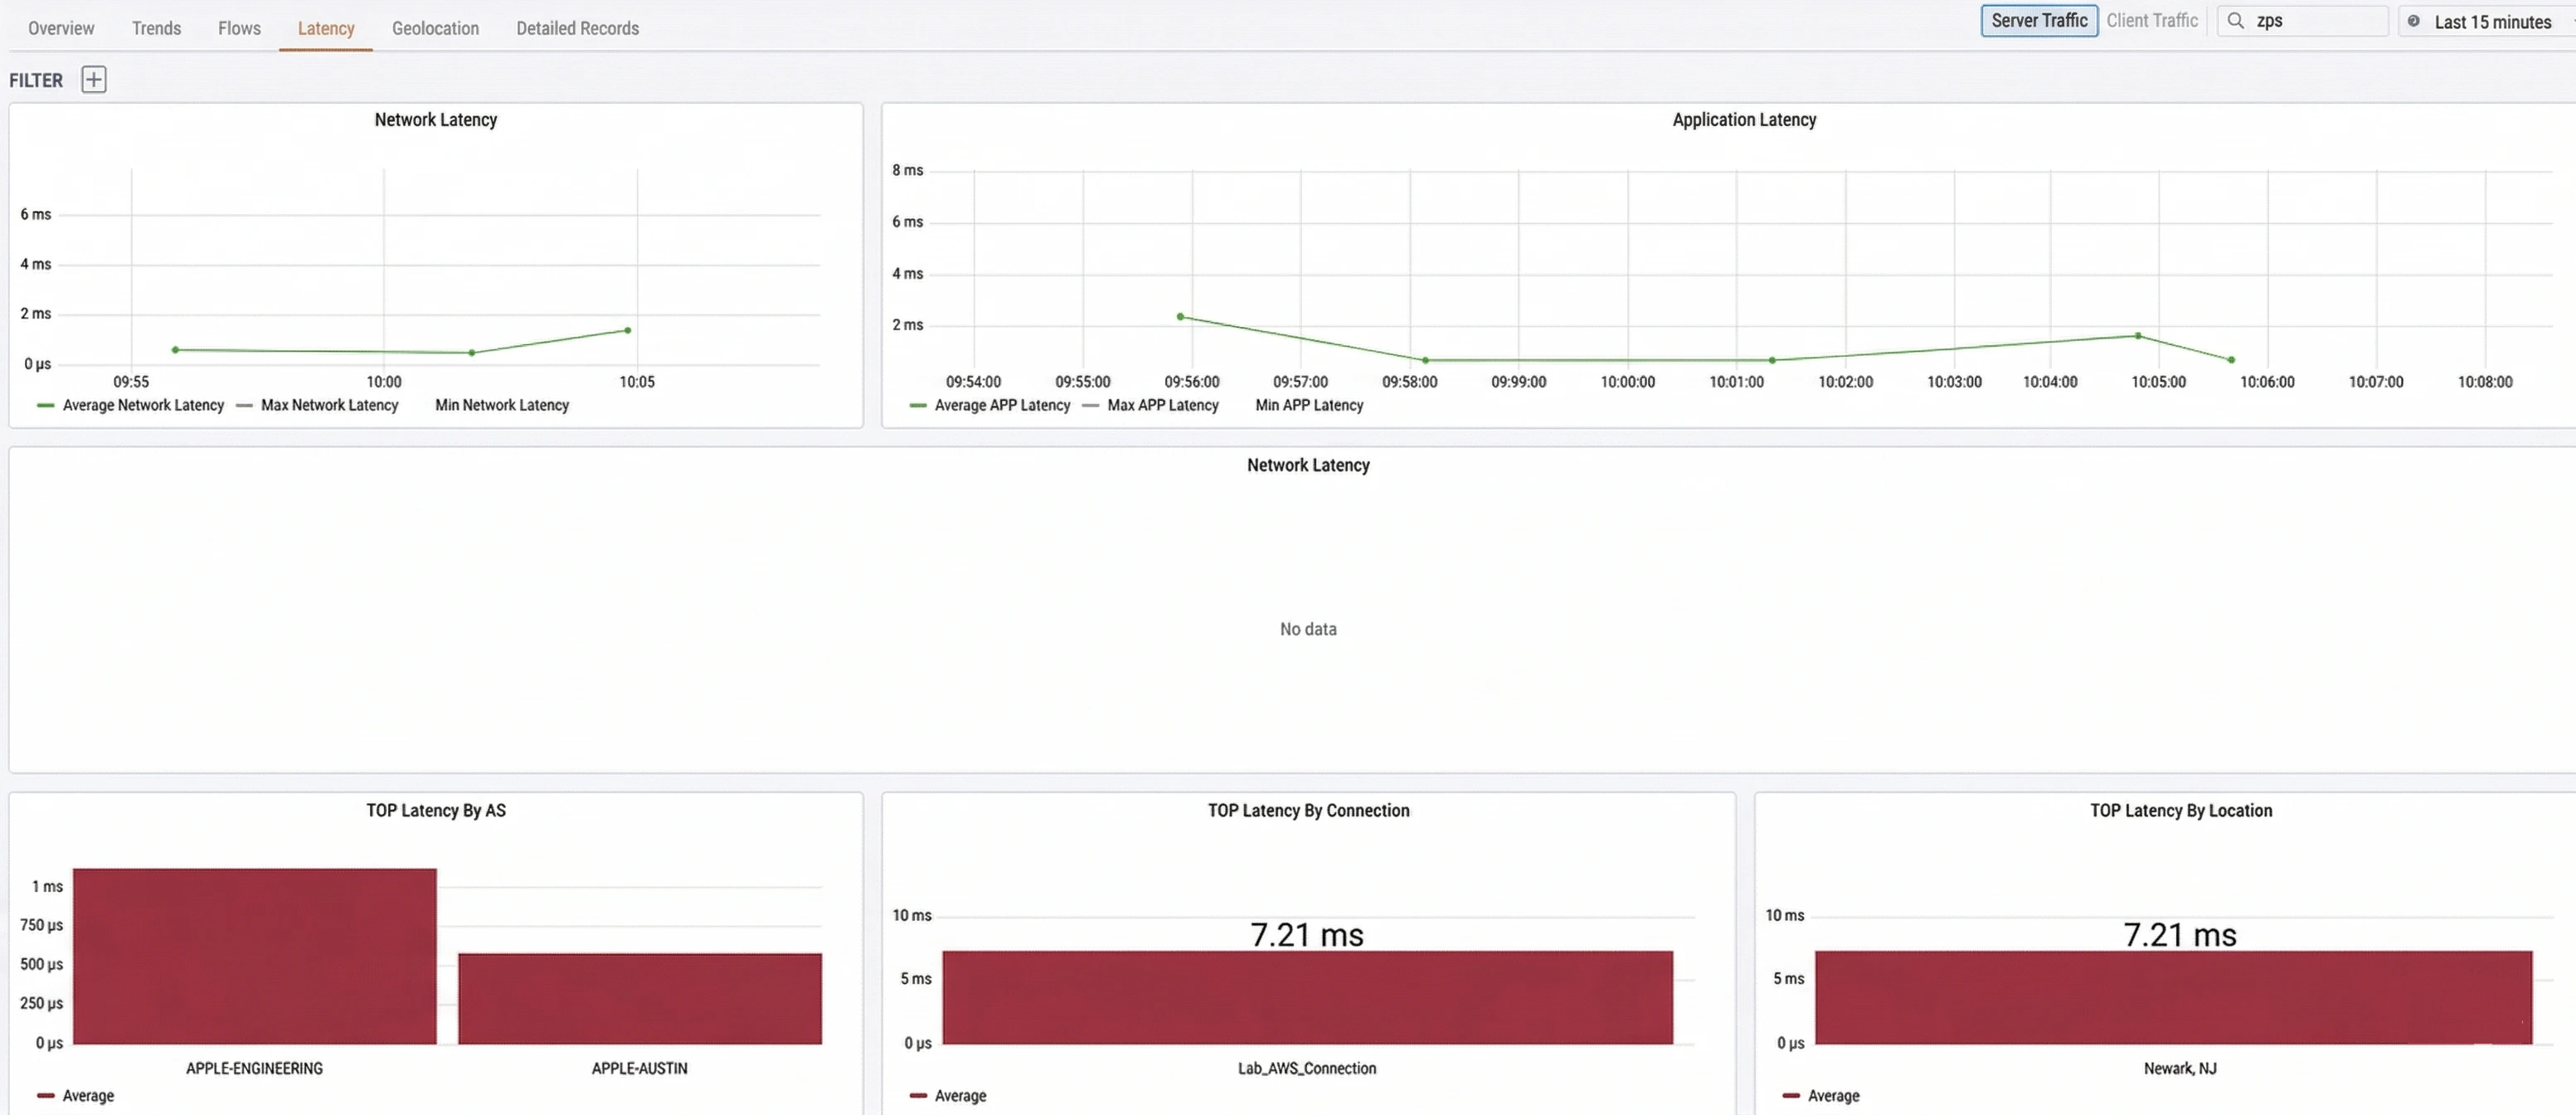
- Network Latency: Plots the average, max, and min network latency over time. Network latency is measured as the round-trip time between a client’s TCP SYN (TCP Synchronize) and the server’s SYN-ACK (TCP Synchronize Acknowledgment), representing pure network transit time.
- Application Latency: Plots the average, max, and min application latency over time. Application latency is measured as the time between the client’s SYN and the first packet of application data, which includes network round-trip time plus server processing time.
| Widget | Description |
|---|---|
| TOP Latency By AS | Ranks destination Autonomous Systems by average latency |
| TOP Latency By Connection | Ranks your named connections by average latency |
| TOP Latency By Location | Ranks your physical locations by average latency |
Interpreting latency data
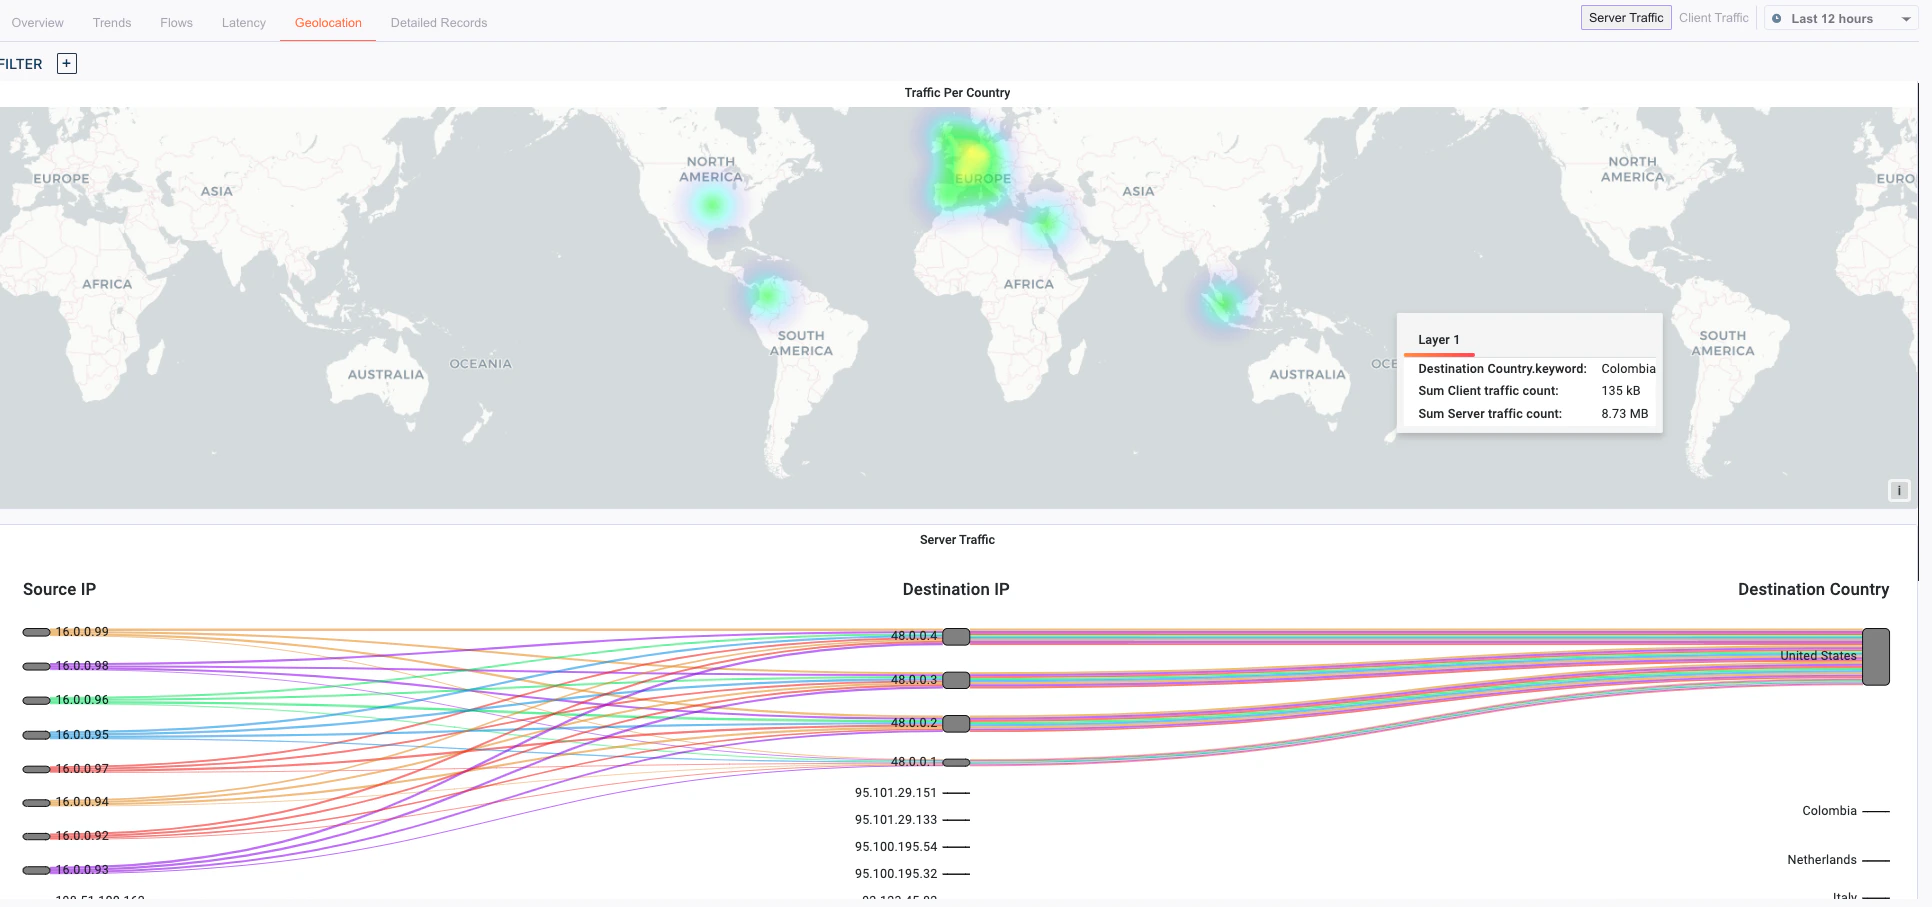
Comparing network latency and application latency allows you to quickly determine whether a performance issue originates in the network or at the application/server layer:| Symptom | Likely cause |
|---|---|
| High application latency, low network latency | The server or application is the bottleneck, not the network |
| High network and application latency | A network issue such as congestion, a degraded link, or suboptimal routing |
| Both latencies low but users report issues | Likely a DNS resolution problem — investigate in the Application Observability dashboard |
Geolocation tab

- Verifying that traffic is taking expected geographic paths
- Identifying unexpected international traffic that may indicate a misconfiguration or security concern
- Confirming that users at branch offices are routing through the nearest service edge