


The Troubleshooting Funnel
A key principle behind the platform’s design is the concept of a troubleshooting “funnel.” This structure guides you through a logical and efficient diagnostic process, enabling you to move from a high-level understanding of a problem’s location (“what”) to the granular, log-level data required for root cause analysis (“why”). This prevents the common pitfall of getting lost in low-level data prematurely and streamlines the path to resolution. The funnel begins with the broadest view and allows for progressively deeper dives:-
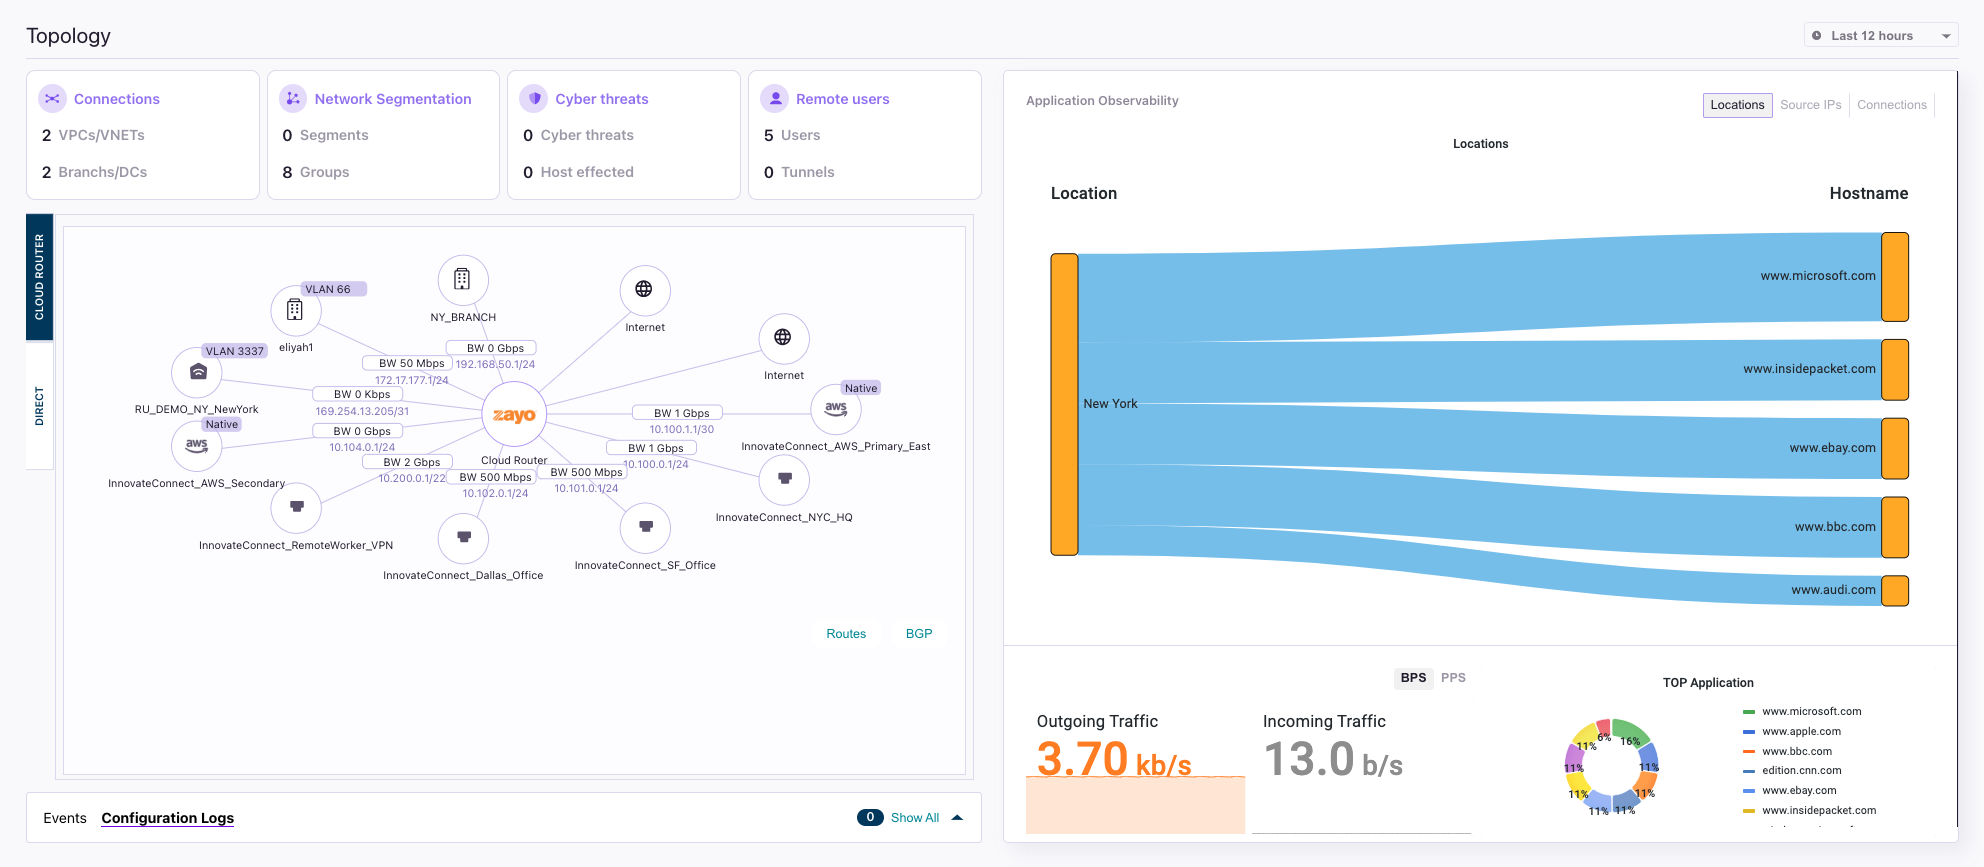
High-Level Visualization (The “What”): Your first destination is typically the Topology view.
-
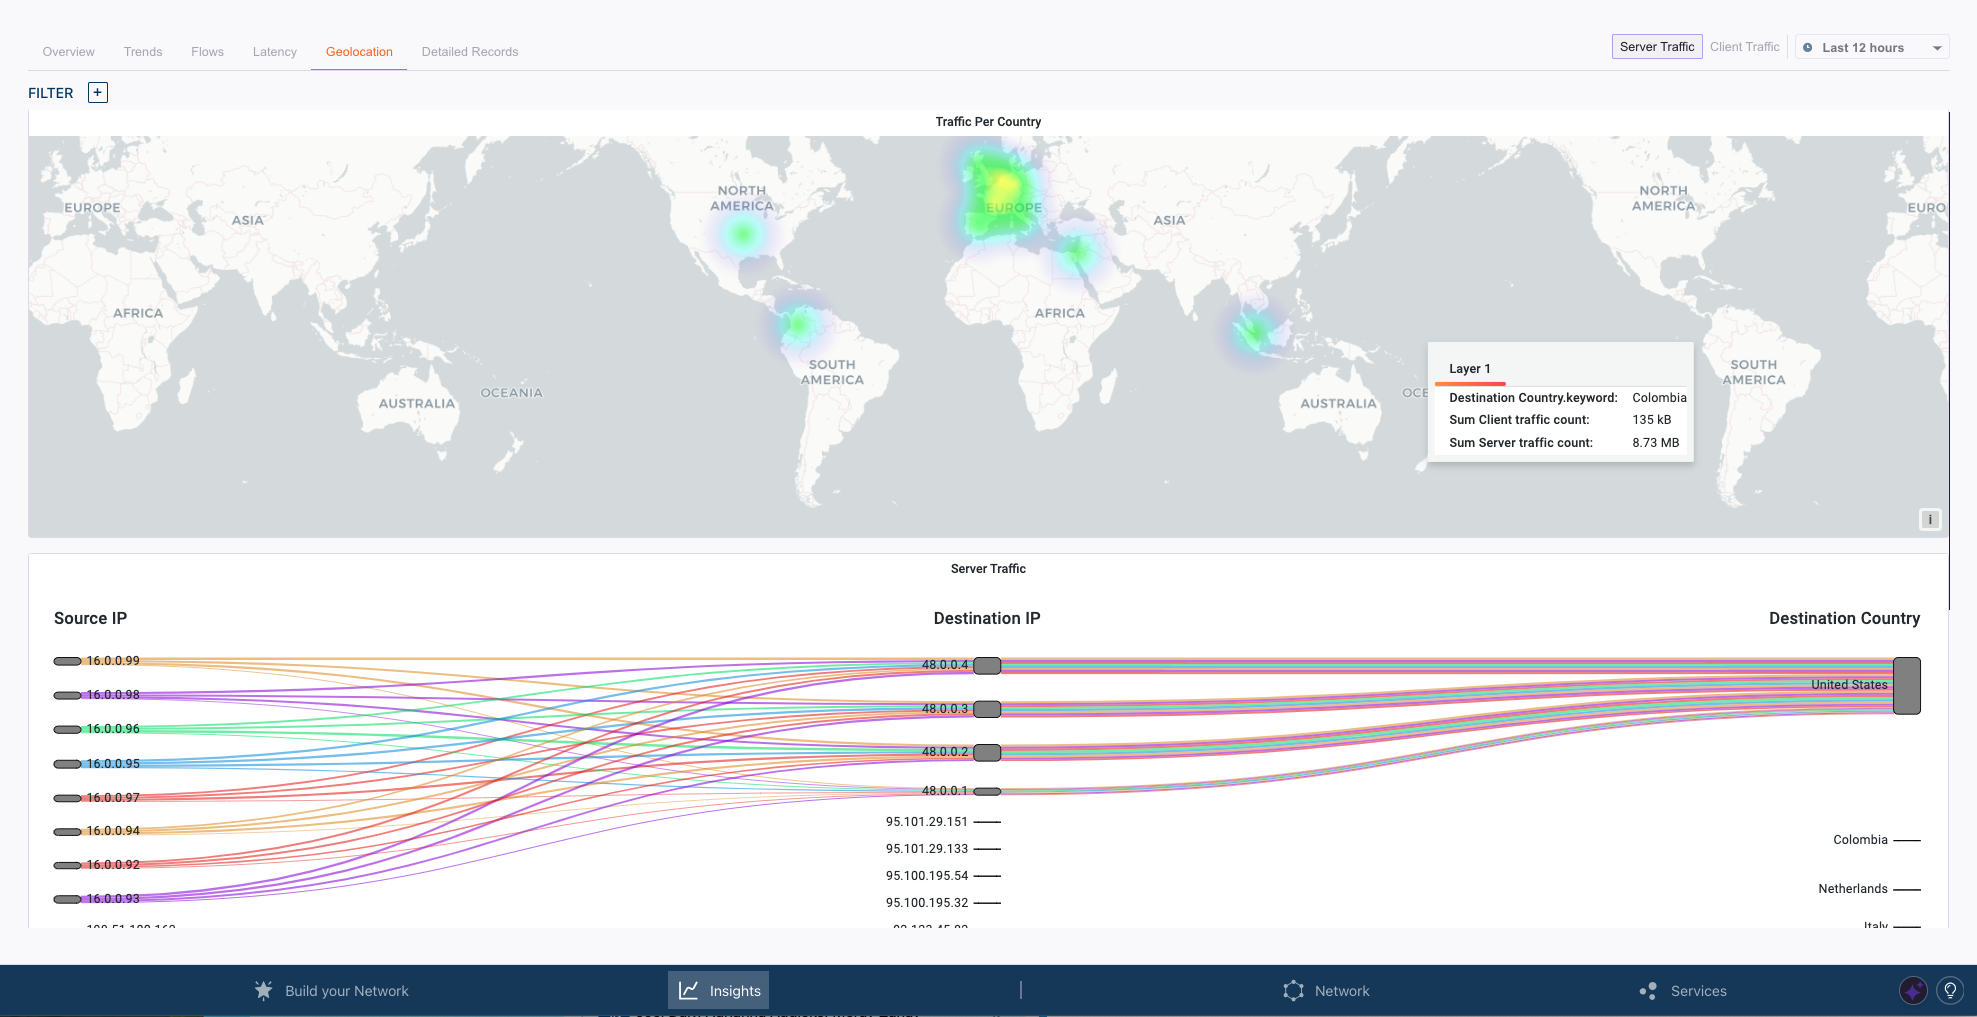
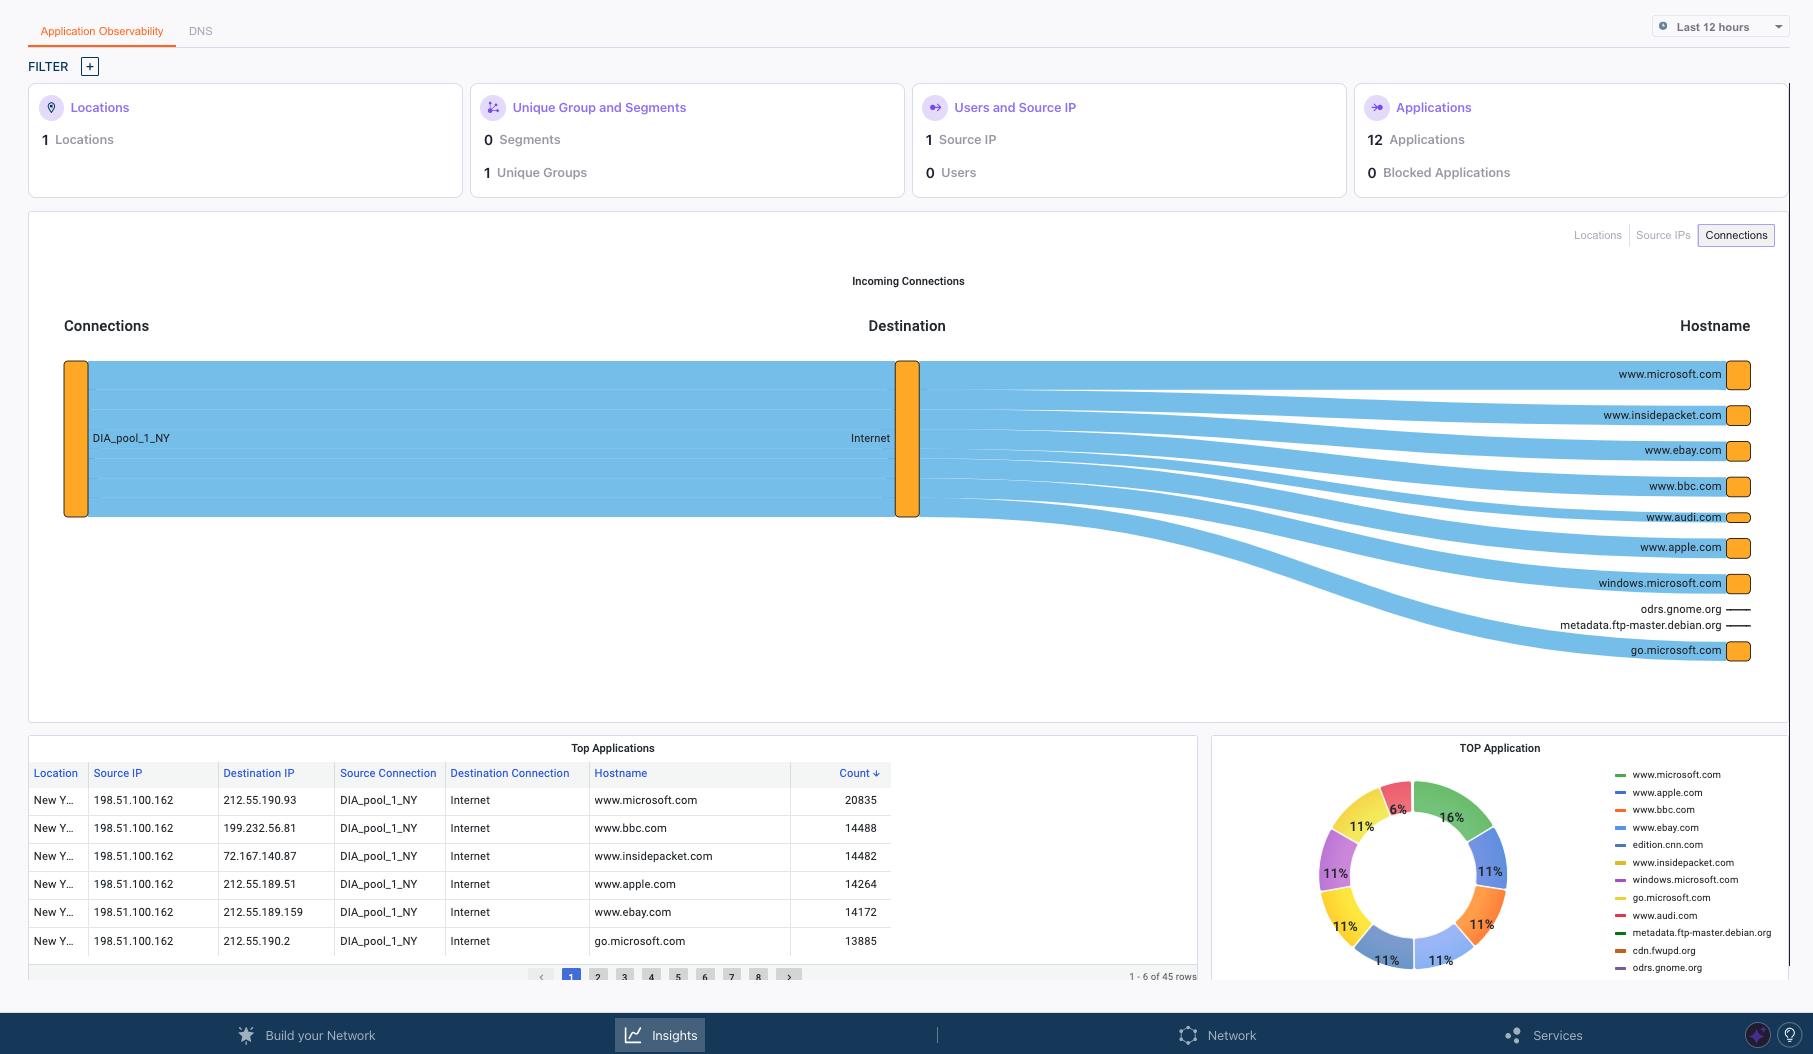
Performance Analysis (The “Where”): From the topology, you can “funnel down” into the Network and Application Observability dashboards.
- Granular Statistics (The “How Much”): If more quantitative detail is needed, the next layer of the funnel consists of raw Interface and Service Statistics. These detailed counters for traffic, packets, and connections can be accessed throughout the portal by switching to the statistics view (indicated by a pie-chart icon) or by accessing the integrated Grafana dashboards for time-series analysis.
-
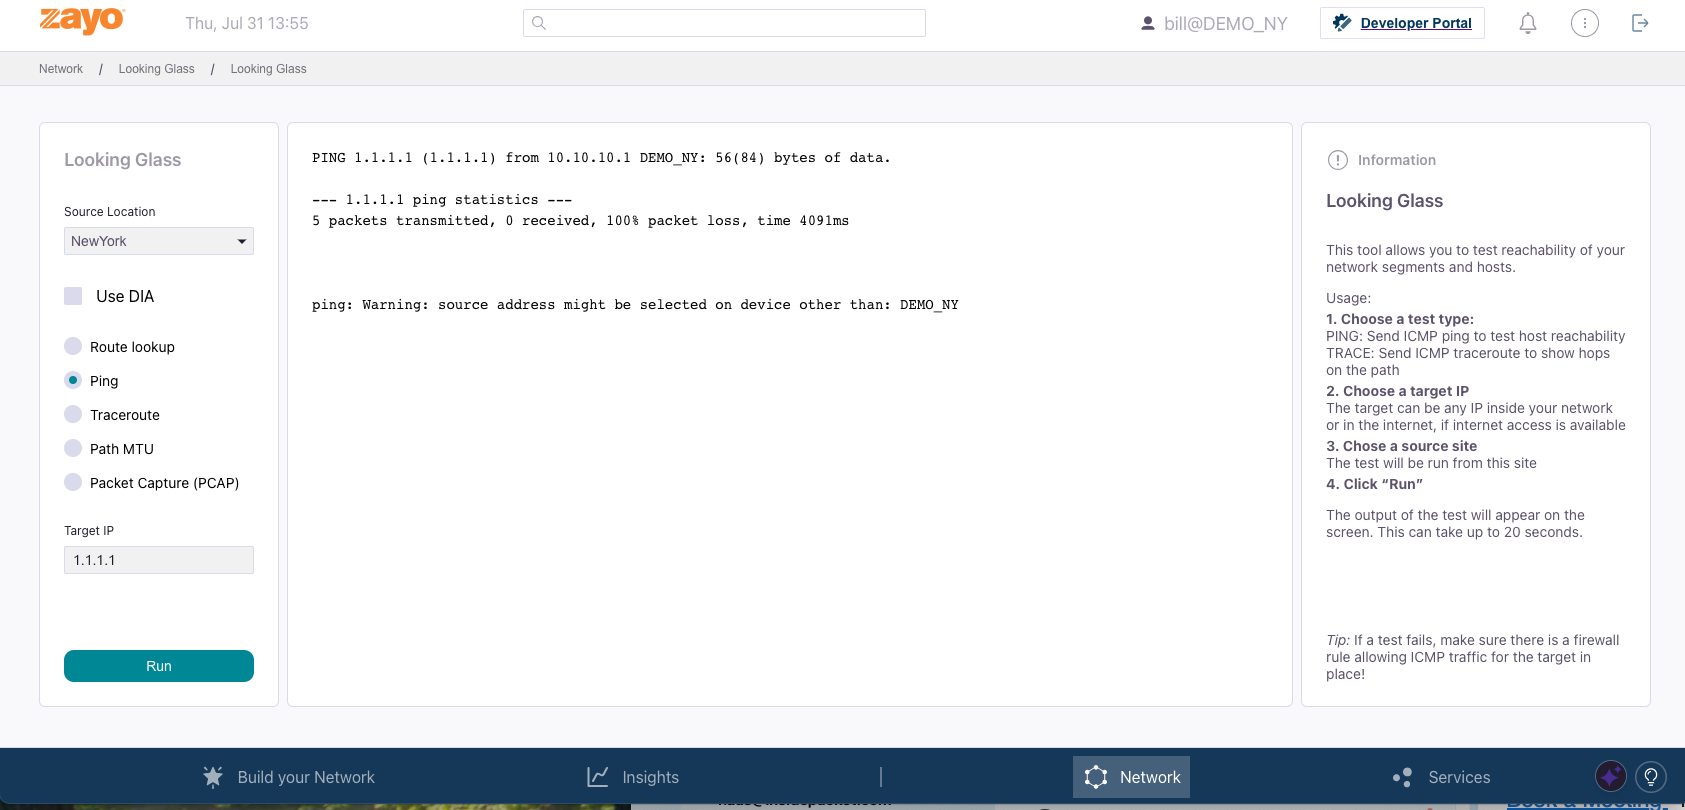
Deep Forensics (The “Why”): The deepest level of the funnel is reserved for forensic analysis. This includes reviewing Events logs, performing complex queries in Kibana, and using the Looking Glass tool for active, real-time diagnostics like packet captures.
Core Insights Dashboards
This structured approach is embedded within the core dashboards available under the “Insights” tab:- Topology View: Presents a graphical overview of the tenant’s network, showing all physical and cloud locations and the connections between them. It displays overall traffic metrics and serves as a central point for viewing tenant-specific events.
- Application Observability: Provides detailed insights into application usage, user activity, and DNS query patterns. It is the primary tool for understanding how network resources are being consumed at the application layer.
- Network Observability: Focuses on the underlying network performance, offering analytics on traffic volume, geolocation data, connection flows, and latency metrics.
- Cyber Threats: This security-focused dashboard displays alerts and comprehensive information about any security threats detected within the tenant’s traffic, serving as the starting point for any security investigation.